
The corners of our anchor charts are peeling away from the walls. The once vivid marker strokes are faded and hard to read. If there was ever a cute graphic in the corner of a chart, it is no longer visible. And it is only October.
I was developing a love-hate relationship with our anchor charts, and the school year had just begun.
Let me be honest. I didn’t really like the way our fifth-grade classroom looked with those handcrafted anchor charts covering the walls. The charts were in contrast to the comfortable and sophisticated aesthetic I had spent my summer establishing for our learning space. They cluttered up our cinder-block walls, and more important, I rarely noticed the students referencing them in their conversations and writing.
A part of me wanted to reclaim our walls and tear the charts down. But another part of me—a truer part—believed the charts mattered. Perhaps the fading, falling-off versions of the charts that clung so obtrusively to our walls didn’t matter, but I believed that the creation of the charts mattered to our learning. Anchor charts are evidence of our shared knowledge. They serve as landmarks in our learning journeys. Certainly, the anchor charts mattered.
Maybe our anchor charts needed to exist in a different way. Maybe our anchor charts didn’t need to be plastered all over the walls, but instead needed a different way to exist in our classroom. Here’s how I revamped our anchor chart system.
Step 1: Ditch the Chart Paper
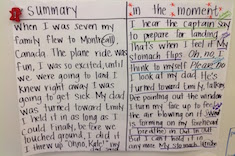
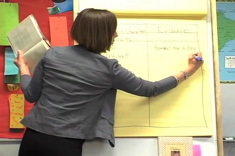
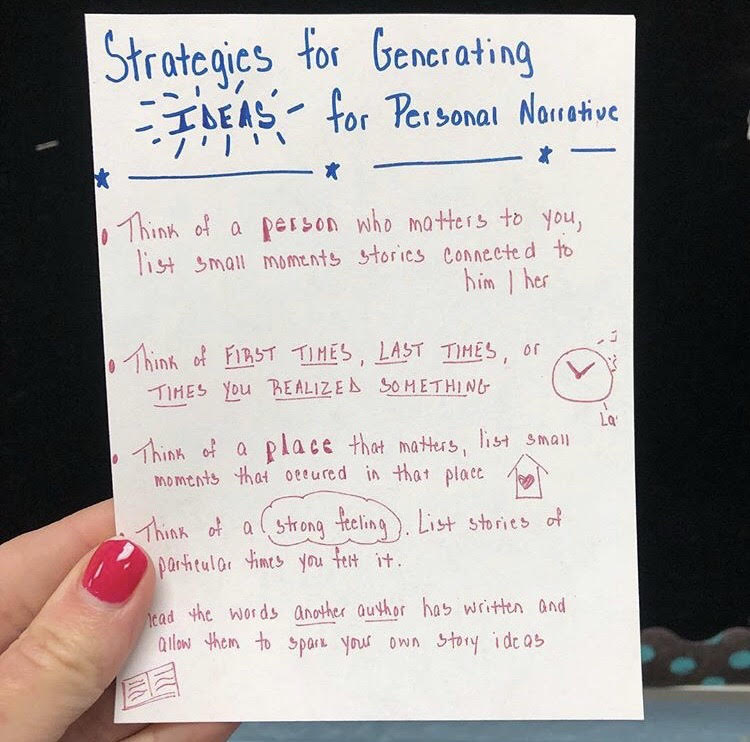
First, I ditched the chart paper and the scented poster markers. I replaced them with a blank sketchbook and some Sharpies. I invested in a 9-by-12-inch blank sketchbook with a sturdy cover and gave it a home in a bin right next to my document camera. Whenever our learning called for an anchor chart, I flipped to the next blank page of my sketchbook, and we co-created our chart right there under the document camera. No learning was sacrificed, and the students were just as invested in the new anchor charts as they were in the old system. It was the creation of the charts that mattered, not the medium.
Step 2: Make the Charts Accessible
The power of an anchor chart lies in its accessibility, right? There is little point in keeping a record of your learning if you are not going to access it later as a reminder or a guide or a reflection. How could I keep these charts (which were now stored in a sketchbook in the front of the room) accessible to all students?
First, I created a mini-copy of each chart on my school’s copy machine. I copied them at 50 percent of their normal size, four charts per page. I cut out the mini-charts and placed them in a pocket chart, encouraging students to “Take What You Need.”
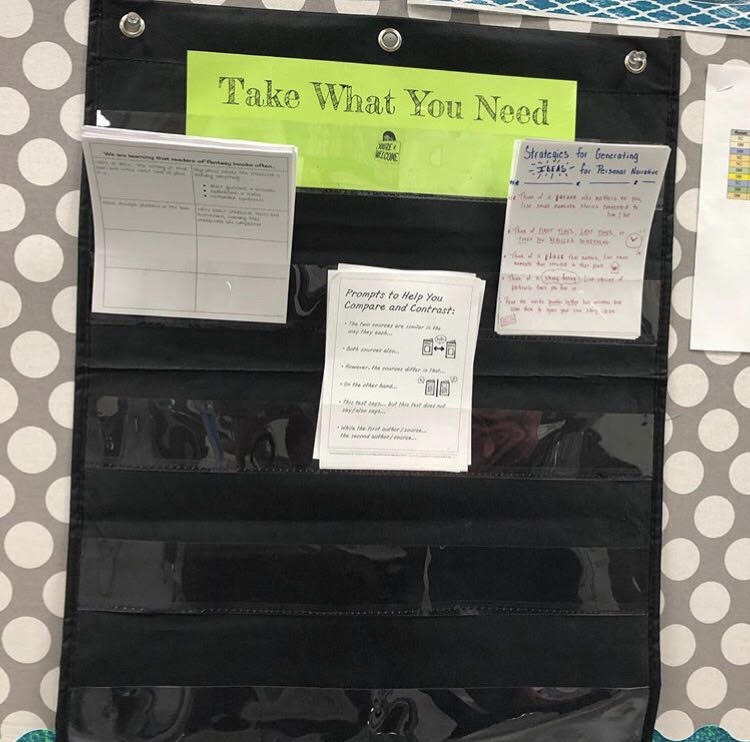
Students could take a chart when they needed one. They could glue the mini-charts into their readers’ or writers’ notebooks, tape the charts temporarily to the corner of their desk, or even just use a chart for a needed strategy and then replace it. The pocket chart helped turn the anchor charts from unsightly decor into learning tools.
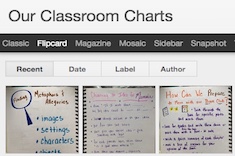
I was also looking for digital accessibility for those students who feel most at home on a Chromebook. Combing through Twitter, I found this brilliant idea by Jen Roberts for using the Web to store images of charts. I created a blog and chose a theme that lent itself to displaying pictures. Using Blogger as my chosen platform, I created a site that would house photos of all our anchor charts. The students bookmarked our new site, and it gave them instant access to all the charts. As an added benefit, there is a function on Blogger that allows me to email photos directly to the site from my cell phone. I snap a picture and send an email, and the chart is instantly published. Easy peasy. I love efficiency.
With our new anchor chart system, I have reclaimed the walls of our learning space. Our room is less cluttered and more pleasing to the eye. Students have reclaimed their learning as well, as they use anchor charts with intentionality and purpose.