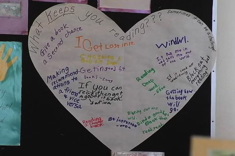
In this podcast, Franki Sibberson chats with Kristi Mraz and Marjorie Martinelli (the authors of Smarter Charts K-2: Optimizing an Instructional Staple to Create Independent Readers and Writers) about ways teachers can keep anchor charts in their classrooms fresh and useful. You can follow Kristi and Marjorie’s most recent work at their blog, ChartChums. A full transcript is available below the player.

Franki Sibberson: I think most listeners use charts in their rooms. My problem is that they all start looking the same after awhile and kids ignore them after we’ve created them as teachers. What are your tips for creating charts that are powerful that students go back to and use?
Kristi Mraz: I’m going to — I’m Kristi, I’m going to field this one first. So I think this is a really common problem and one that both Margie and I have tried to sort out in our classrooms. The first thing that we found to be really useful is to keep the numbers of charts you have small. It’s like one of those things where if you have a thousand of something you kind of forget that you have them, so we try to keep the actual numbers of charts that are small in the first place so that you can go back to the charts and revisit them. My mantra this year has been not to do the next thing but to do this thing really well, and so that’s kind of happened with the charts. I’m back in the classroom this year after working at the compulsion for the past five years and that’s the number one change I’ve seen in myself is that when I make a chart it’s going to get used a lot.
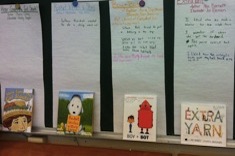
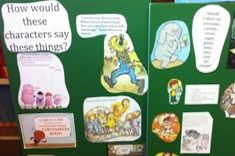
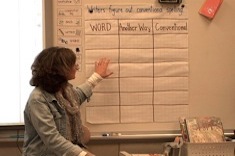
I’m not making the next one before this one feels really good. What I found works, I teach Kindergarten so their attention spans are limited. So what I found is that one of the ways to make sure they get used is to involve students in the construction. Students just like anyone are more interested in things if they’re involved in it. It’s like how, you know, you may look at people’s Facebook photos that you’re in. So using children’s images on charts, their photographs, or using their student work, but also sometimes taking a chart that’s not working and rethinking it. I had an experience this year where I had the writing classes start. Think of an idea, plan it, write it, go back through the whole process again, and it’s been up since September and I was getting really frustrated because I look at their page, at their work in their folders, and it would be like one page pictures or words, nothing on the rest, or like one page pictures words, next page just words, last page words. So I was getting, you know, sort of sad that they weren’t really following the process, so I ended up making all those big parts — think of an idea, plan it, write it, go back — and made them separate little things with pictures attached.
We almost did the lesson as like we’ll have you see if it makes sense, like what’s the order that makes sense for these to go in? So we put them up and they went crazy the first time. It was like go back, then write, then plan, then think. And so like the whole lesson was sort of like rethinking how the writing process goes that makes sense. One of the changes I tried to be open to is they wanted to plan and write next to each other and so I rolled with it because that was the process that made sense to the class.
Franki Sibberson: So you talk a lot in your book about your beliefs about teaching and learning. How do you chart the line with your beliefs about teaching and learning?
Marjorie Martinelli: Hi Frankie. This is Marjorie Martinelli. This is a favorite question of ours because they definitely do go hand in hand. First of all, like Kristi said before, they are co-constructed with the children and developed thinking about their zone proximal development and what they’re ready for next. So it provides a scaffold for the children to lift the level of what they could do independently, to what they can do with a little bit of help. They help with being really explicit and clear about what we are teaching and they’re made for the children but also, like what Kristi said before, they’re also made with and by the children which is one of our foundational beliefs. Lastly, they provide children with the language to talk about their learning, right? And that also helps with their metacognition. The ultimate goal is increased independence.
Franki Sibberson: You talk about that a lot. I love that. So it sounds like you have a really clear kind of planning process that you go through in your thinking about creating a chart. Like I know I just kind of flip the chart and we just make a chart. I don’t know that I have a really good planning process. Can you talk about the planning process you go through when you’re thinking about creating a new chart that you’re really going to use for awhile?
Kristi Mraz: Absolutely. So back to Kristi. So one of the things that I do think about – do I sit with my team for this? Absolutely? I feel like planning out chart goes right alongside with planning our units in reading, writing, math, and inquiry. We tend to think, we tend to limit ourselves and not say – I mean the nice thing about a chart is because there’s limited space it also kind of helps you think about what’s really important that you’re teaching this year or this unit. So you could make a million charts about little things, like one about adding dialogue and another about adding feelings, but there’s a way in which, when you sit and you think okay I’m going to try to limit myself to about three charts for the month with things underneath them.
What am I really trying to drive home? What are the things that I want kids to be more independent at by the end of this time? It really forces you to think about what you value and what matters. So often we sit and we identify three or four big goals or skills. So let’s say it’s writing. Often times the first one is getting comfortable with the genre, so we just wrapped our persuasive unit and so we thought about what do we — we have a chart that has to with what a persuasive letter is and isn’t, or what persuasive writing is and isn’t. Then we’re going to have some sort of chart or an elaborate big goal we chose was readability because when you’re trying to persuade someone you have to be able to read it. So then once we have that, those three big goals, then those would be sort of the headings on our three big charts, we thought about the different things we’d be teaching underneath each one and that sort of helped us think about our chart.
The thing that we talk about in Smarter Charts is that there’s sort of like you don’t use a hammer on a screw, and I’ve tried – it doesn’t work. You don’t always need a strategy chart. Like a strategy chart often a go to chart and so sometimes we think about the different kinds of charts that we could use to give some of the information for what is persuasive writing. We made what’s called a genre chart, which basically just has an is and is not example. So that’s co-constructed with the kids and you know, it might be a book like The Three Little Pigs
against Click, Clack, Moo
or something like that and how is one different than the other? Or a sample of a letter next to a sample of a persuasive letter and what’s the difference. And then for the elaboration that was kind of a strategy chart where like persuasive writers say a lot and so here’s the different things you could say in a persuasive letter.
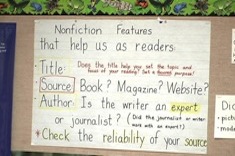
Then the third big goal, which is making it easy to read, we made what was called an exemplar chart which was a letter that we had written together as a class in writing and notated with like speeches, sight words, neat handwriting, the things that made it easy to read. So we think about both what’s going to go on it and what behind the chart will help you do that. Then the last thing I really think about is even though I have a visual in my head or a vision in my head of what the chart might look like, I’m co-constructing it with the kids. Marjorie made a great suggestion that you know, just because you’re making it with the kids doesn’t mean you have to make the actual thing with the kids. You can start to sketch it on a dry erase board with kids and then go back and create it when you have a little more time. Or you think what am I going to create with the kids? Am I going to take the language from them, am I going to have them illustrate it, am I going to take their student work? That’s sort of the last thing I sort through.
Franki Sibberson: I love that. I’m like rethinking everything now. I’m like how many things do I do on chart paper and then just slap up because it’s on chart paper?
[laughter]
Kristi Mraz: You feel like if you’ve made it on chart paper, it’s a chart.
Franki Sibberson: I love that planning piece. So you talked a little bit about this, but how do you balance your teaching goals? Then when you come to the place with the kids, what the kid’s thinking when you’re creating these charts. You go in with these goals, how do you balance that out with what the kids bring to the table?
Marjorie Martinelli: This is Marjorie here, but continuing what Kristi talked about, once you definitely have your goals in place but we also have to keep in mind that we don’t necessarily need a lot of fancy language around these goals, right? So it’s almost like you want to think about what’s going to be understood by the children, and using their language can help. So for example, we might know that we want them to infer how characters are feeling by looking at the pictures and their facial expressions and physical actions. But for kids it’s just like you look at the picture, or look at their faces, right? So we can kind of think let’s simplify that language, and they know what it means and you know what it means because they’re actually doing it together.
And then you say what should we call this, or help name it, as well as some of the things too can be even when kids are starting to do the work, I think as teachers we need to always be open to better ways. Like sometimes kids invent strategies that we never even thought of, like solutions or problems. So I think that’s part of it, is just being flexible and open to hearing what they’re doing and saying, as well as sharing the charts with the children. Like let’s look at this chart and think is it clear? Is there anything that would make it better or easier to understand? Is there anything we don’t need anymore? So really getting them — like I said before about co-constructing, really getting them involved in it. Like I said, just be open to, they’re going to surprise you like Kristi said before about they wanted to put the planning next to the saying what’s going to go on and I think that’s huge.
Franki Sibberson: I love that being open.
Kristi Mraz: I’m just going to add on a little bit because I have a story for this. So I like to joke that charts are a living document, like the Constitution, which is true. Like I find what’s happening this year, now that I’m back in the classroom and I’m sort of taking some theory into practice on a daily basis, is that the charts get amended more frequently than not. So if I’m setting up to teach something, sometimes there’s something explicit I want them to know and so I’m going to teach this to you. But then working with them in conferences and small groups, there’s a dialogue in which I realize oh this other thing you’re doing is another way to do this thing so now that’s going to get on to the lesson, or next to it or under. My charts have started to like sort of become slightly more three dimensional.
Something gets placed over the top of, let’s just pretend I’ve made it three dimensional, but something that’s to the left or to the right of. So like the one that’s on the left talk about math. One thing that happened is we were talking about turnaround facts and every time I said turn around they would be like what’s that? And the kid would be like it’s the switcheroo, like they just had hooked on switcheroo and so it said turnaround on the chart and we changed it to switcheroo because it was like Marjorie said, what they knew and so we just put switcheroo on top of turnaround and I’m trying to get them to use turnaround, but for that moment to understand it they needed switcheroo to be on there.
Franki Sibberson: I like that amending chart. Okay, you guys have me crazy thinking now. Okay, so this is a question I have, probably you don’t have trouble with like I do, but I always struggle with when it’s time to take a chart down and how to find the space for those charts that we used earlier in the year that somebody might want to go back to, we might want to go back to later. What do you do?
Kristi Mraz: Well I remember my first time when I was teaching. I was like on a table, on a chair, like using the yardstick to smack my charts up to like the highest part of the wall. Because it was like this isn’t coming down! I worked hard on this! And so I feel like that’s what they, this year I’ve really worked on, is keeping a space where the current charts for each unit are. So I have the space for reading current units, writing current units, math current units. I’ve tried to get really good at taking pictures of the charts and making them shared reading. So they have shared reading folders.
I just take the picture, I print it in black and white and hole punch it and it goes into the folder. So they have sort of a collection of many — not every single chart — but many of the charts in their shared reading folders and they will access that and pull it out. You know, if I’m going to revise for next year I think I might give the shared reading folder halves almost so that there could be these are my charts, these are my poems. But I find photographs of them and having them accessible — I’ve shrunk some down to mini-size, put some on kid’s folders, but at the end of the unit I tend to clear the charts and we start fresh again unless it crosses over from one unit to another. I’ve had charts that do that. I’ve had charts up for a couple of months. But I really try to keep myself within the space I’ve allotted and if I felt like I needed to keep it, I found a way to shrink it down and make it smaller and make it accessible.
Franki Sibberson: I love that printing it off.
Marjorie Martinelli: Just to add on to that. I kind of talk about it as kind of like the three Rs of charting. You can reposition them, you can revise them, or retire them.
Franki Sibberson: I like that! I love this.
Kristi Mraz: We’re all about coming up with slogans.
Franki Sibberson: It’s so intentional. I mean I feel like we started off with charts intentional and then we just kind of went chart crazy, and now you’re bringing us back to being intentional again about what we’re doing with them. So it’s amazing. You talked in the book, and you’ve already mentioned it today, about the importance of setting kids up for independence in the role of charts and that. How can teachers use charts in that way? How do you see that happening to do that?
Marjorie Martinelli: Well basically, the charts are designed so kids can be proactive, right? I mean Peter Johnston’s always talks about agency, right? Developing in children a sense of can do attitude, and the charts are one place that kids can go to when they get stuck, right? They can go to the chart when they want to kind of see if what they’re working on matches some of the things that we’ve been teaching. It’s a way, like you can ask them is there a way you can tackle this problem yourself? Is there a chart in the room that could help you? You can think about even using the charts for their self reflection and self assessment. So, for example, you might have some kind of exemplar pieces of let’s say writing on the chart, or even photos of kids doing certain things and then kids can kind of go up and say do I look like that when I’m with my partner? Or does my piece of writing look like this when I’m finished with it? You know, so that’s a really powerful way.
In order to do that the location becomes important. So are the charts accessible? Are they visible? One of the ways we make them accessible is besides having them in a very clear place, like Kristi said before, here this is where we keep our writing charts, here’s where we keep our reading charts. We also can make them accessible by bringing them right to their table. We’ve done a couple of blog posts in the past year on table charts for example, different ways that you can bring the charts, you know, make them 8 ½ x 11 and set them up on stands on the table, or in notebooks on the table that kids can refer to. We also have kids like putting post-its on the strategies on the charts that they’re using, or they put a post-it with their name on it next to a strategy that they’re going to try to use today, right? So they’re constantly being touched and interacted with by the children. That helps them, it really does help empower the kids because they feel — there again, that can do attitude.
Franki Sibberson: So many great strategies.
Kristi Mraz: If I could add on for a second. One of the things that I found to be really useful, which sort of happened by accident this year, is that I had started putting some student work examples up on charts and then once some of those kids started volunteering, well I can show people how to do this, and so it started to become now that for almost every single chart I have, I try to make sure everyone in my class is represented. There’s a couple of names up from each thing that if you need a little assistance on this thing, these are people in the classroom who feel confident and can help teach you that. And so it’s also — and I think one other thing. I teach Kindergarten but I think this is true across the board.
I think when you’re a workshop teacher or any kind of teacher, you’re equally weighing content with habit, with like becoming the type of person in the world that we want and we value. One of the things that I feel like I’ve tried to do more of this year, and I know other teachers have as well, is I’ve tried to tell the story of who our class is and ways that they’re active and they’re problem solving, and that they’re the type to not get knocked down, that if the blocks fall down that we’re the type of class that says no big deal and fixes it. I find that charts kind of give you a way to anchor that narrative because you can say you know, this child was stuck but he didn’t just sit there. He thought I can help myself. He went up to the chart. We’re the class, we’re the type of people, who when we have a problem we look for how we can solve it. One of the ways is by using the tools around us. That’s like a life lesson that the charts sort of stand in for but it’s so important.
Franki Sibberson: I love it. Okay, so I’m totally hooked on that glue you guys recommended that makes the —
[Inaudible]
Franki Sibberson: So I just want to buy it and have it all the time. But what are some tools like that one that teachers need to get started to create more powerful charts. I think I go out every year and just buy several pads of chart paper. But what do we need?
Kristi Mraz: Well I can give a few maybe packet things to think about as well as the usual. I myself am a big fan of a piece of chart paper, 8 ½ x 11, brightly colored paper, and that restickable glue stick. If you go to ChartChums, our blog, or you look in the book, you’ll see tons of examples of that, and a really juicy Sharpie. But there’s also some really nice apps that can help you make some powerful charts. One is an app that’s called Snap and it allows you to take a picture and then annotate the picture. So if you take a picture of student work or you take a picture of a child doing something, you can annotate the picture and then print it with the writing on it. And that can be really nice to put up on a chart, especially if it’s like a partnership picture or something like that. The second thing that I’m obsessed with is iFontMaker for the iPad.
Franki Sibberson: What’s it called? I what?
Kristi Mraz: iFontMaker.
Franki Sibberson: Okay.
Kristi Mraz: So it was designed for people to make their own fonts. It’s very simple, very intuitive. So when I first got it the first thing we did was make like a kindergarten font. So everyone used their handwriting and it was very cute. But then I realized that it doesn’t care if you put a letter or not, so then what I started doing was for each letter drawing the icons that I often put on charts so that if I was typing, just pull up that font and insert the visual as I went. So it made it so that I could insure that my visuals were the same between and I didn’t have to go and hand draw back in, I could just very easily insert it. Then the third thing was that with that same app, the kids and I started co-constructing visuals and printing them out. It was very easy, because it’s a font you could just print it out on labels. So kids would be like this is the visual that goes with, let’s say, using the word because. You just have to make it size 150 when you type with it so it’s big, but I’d put labels in the printer and I’d print out a whole bunch of those so if kids had that as a goal they had a visual they drew and we could just slap it on, and it made things amazing.
Franki Sibberson: Wow.
Kristi Mraz: I have one last one and I’m done.
Franki Sibberson: I was all excited about the glue. Now I’m real excited. Okay, go ahead.
Kristi Mraz: For those people who have smart boards and document cameras, I’m new to that this year and when I wasn’t busy breaking it I actually learned some good stuff with it. So one is that depending on your set up, you can often take a photo from your document camera and then annotate it on your smart board, or it’s also very easy to take a photo of something, put it into your smart notebook software and annotate from there. So towards the end we did a lot of work looking at student work and annotating what kids had done that was like so incredible. And then kids got to use the smart board pen and tools and we just printed it out and then put it up, and it was just another way to use text and get student work up but have it kind of come from a different angle then the photocopier.
Marjorie Martinelli: The technology is amazing. Just so you know, I do come back to what Kristi said first to about a really fresh black marker that glows from the page because it just makes everything you write pop.
Franki Sibberson: Right.
Marjorie Martinelli: I had a friend of mine, she looked at all her charts and she said what’s wrong with my charts? And I’m like they look pale. So she went over and she just went over them with a thicker marker and it’s like oh my god, it even makes my handwriting look better. Then one additional tool that Kristi cannot use too, is just a place to contain some of the charts, especially if you’re using the homemade post-its or the 6×8 post-its. You can actually house them in like an 11×14 or a 16×20 sketch book that becomes like a scrap book of your charts. It’s also something that you can use for small group work. So I find that is also a useful tool to help carry your charts around with you, makes them a little portable as well.
Franki Sibberson: I love that. I can’t wait to go shopping now!
Kristi Mraz: I know!
Franki Sibberson: Well thank you girls so much! This is wonderful. Lots to think about, and exciting stuff.


