Assessment systems that work are difficult to find. I’ve been teaching for just over 20 years now, and I’m quite sure I’ve tried nearly that many systems for organizing assessment information. I’ve tried mailing labels, note cards, file folders, and post-its (that was a mess!). I’ve created charts, templates, grids and checklists. I’m fascinated to see how other teachers collect information in their classrooms, and until a few years ago was always looking for a system that worked for me. I think that’s the key: finding a system that works in YOUR classroom. About five years ago I tried to find a system that allowed me to keep individual conference notes over time in one handy place. Using a spiral notebook, I divided the pages so each child had 3-5 pages, and kept notes on reading and writing conferences.
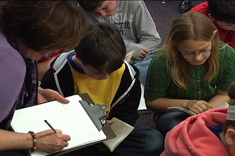
The spiral notebook worked well for tracking conversations with individuals. Whether it is reader’s or writer’s workshop, I sit down beside a student and record our conversation. I usually record the piece the student is writing or the book we discuss, what I noticed about the reader/writer, and then write my teaching point off to the right side of the page. By recording the teaching point, I am sure when I sit down the next time to be purposeful in my instruction to the reader/writer. Recording the teaching point helps me to stay focused on the child, and not teach to the piece of writing or the book. It makes it easier to notice patterns over time, strengths of individual students, and provide tailored support. These notes are bread crumbs I leave for myself so I know where I’ve been as I venture down the trail. I love this system and, amazingly, am still using it today.
By using a notebook to record notes, I have allowed myself to move beyond the “levels of my readers”, and focus more on the behaviors of the readers in my classroom. I’ve been able to think more about the strengths, patterns, and areas of support of individual children. I believe in using opportunities to teach readers across my day. However, you can imagine the challenge with a notebook. You know the difficulty in checking a student’s conference notes during a read aloud. I don’t think my first graders will wait patiently while I return to conference notes in the middle of our discussion. Additionally, individual notes made it challenging to notice small group and class trends. I realized I needed something that allowed me to look at my class in a glance.
My friend Deb Frazier teaches across the hall. Everyone needs a friend that will push your thinking, help figure out the teaching pieces that aren’t working as well as you’d like, or just send chocolate across the hall in times of desperation. She suggested I try putting the reading information on a grid. She was using a grid, and I eagerly gave it a try. I’ve been using it ever since! As we’ve been working together over the last few years we’ve added to the grid. It has evolved as a result of new district assessment systems and changes in our thinking as we work with readers. It will likely change again this year.
As a first-grade teacher, I take several benchmark running record assessments across the year. I like a little data to back up my thinking about student progress. I record the individual information from the benchmark assessments to the class grid so it is in one place for quick reference. I fill out a reading grid at the beginning of the year using the previous year’s assessment data, several times across the year as I reassess readers for a better picture of progress in our room, and at the end of the year. (Yes, even at the end as I like to compare my end-of-year data across groups of students. I’m crazy like that!) You can access a blank copy of the grid by clicking here.
You can view a sample of the completed grid (with student names obscured) by clicking here.
What’s Included on the Class Reading Grid
Here is what I include on the class reading grid. Your grid elements will be different from mine, depending upon your required assessments. The key is to find the mix of notes, codes, and numbers that work well for you.
Instructional Text Level: You will find instructional level at the beginning of this grid, but not because I think it is most important. It is usually the information I am asked to report to the district. If I were putting this grid together by importance levels would probably be at the end. When completing benchmark running records, I stop my students when I find instructional information. Rarely do my students stop because of accuracy scores. Most often their reading accuracy is easily above 95%. Typically students have difficulties in areas of comprehension, so I stop because I have gained the instructional information I need, and because the structures of the text seem to have an appropriate level of challenge. These levels give me a range of books students might be successful reading, making it easier for me to make decisions when choosing books for instruction, but these levels will not confine or dictate the books students are reading in my room. I am quite certain I could take any “level” of reader, and give them a book that is two levels lower that would be difficult or one that is one to two levels higher that could be read successfully.
Information on Strategies Used to Sustain Reading (i.e., accuracy, cues used, self-correction, and rereading): In these sections of the grid I record the accuracy for this benchmark assessment, circle the cues used (meaning, structure, and visual information), record the self-correction rate, and note rereading. I’m looking at the behaviors of the reader in this section. I like to see accuracy scores that are 95% or above, self-correction scores that are 1:3 or better, and rereading that supports the reader at difficulty. I often note the cues used to self-correct. Did the child use omitted information to self-correct? If so, that means she/he is beginning to notice new information and is usually a sign of progress. Did the child further search information to make the correction? If a child has used meaning, structure, and visual information, I consider that to be a good error. If he/she goes on to self-correct because he/she searched further in one of these errors that is a sign of progress. I also make notes about the amount of rereading the child does. Early readers tend to go further back in the text. More experienced readers can often reread a word or two to make self-corrections or make sense of difficult text.
Fluency: This score is determined from a rubric in our assessment system. Students can receive a 1-4 score on fluency (one is least fluent, four is fluent). Our district is currently using the Fountas and Pinnell Benchmark System that has a rubric for fluency. I also note in my grid what I noticed about this child’s fluency by circling the letters of the fluency behaviors I noticed. Was the pace (P) of the reading appropriate? Did the reader read in helpful phrases (PH)? Did the reader use expressive (E) intonation to demonstrate understanding?
Comprehension: The comprehension section of the grid is the largest section, and for me the most important. This part of the grid is divided into two parts: within and beyond the text. These sections correspond to the sections in the benchmark assessments we use. The within section includes an understanding of the main idea, use of story vocabulary, demonstrating sequencing, and noting details. To me, the within section of thinking demonstrates a reader’s ability to understand key ideas in the story as they were explicitly stated in the text. The beyond section includes use of evidence, connections, predictions, questions, and inferences. This is the section that demonstrates a reader’s ability to think beyond the text – to put thinking and learning from the story in the bigger context of her/his world. When marking this section I use the letters B (beginning), D (developing), A (achieving), and E (extending). Any set of symbols will work, but these match our grading system so it makes it easier for me to use them consistently. Noting these behaviors allows me to quickly reference a child’s strengths and challenges in reading new text.
Notes: This is the section where I add student goals and any notes I want at hand immediately when planning and working with students. I write microscopically so it is easy for me to fit my comments into this space. Additionally, I only want key words that will grab my attention quickly. This isn’t the place for a narrative, just quick notes about where I think students need to be moving forward.
Readers change a lot in first grade, and it usually seems that in about six weeks (for those of you that like numbers) I find myself needing to rethink instructional plans for my students as a class and as individuals. Six weeks is an approximation as I create a new grid when I start to feel like the grid I am using, even with updated scratchings, no longer gives me good information about my readers. As a first-grade teacher, I find the information about readers changes quite often in comparison with other grade levels as growth is in giant measurable leaps. There are also a lot of changes in text structures these young readers can handle across the year. I’m quite sure I take more benchmark running records than most teachers at other grade levels.
The grid allows me to look at the class as a whole and consider the reading behaviors I need to support with the class, small groups, and individuals. After completing a grid, I take some time to really think about the information student data has provided. Recording information on the grid allows me to look first for students who may stand out from classmates as having difficulty keeping up with peers, exceeding the growth of other peers, or having different needs than most students. I usually take a yellow highlighter and mark individual places on the grid where students were not as strong as I’d like them to be, and highlight in pink those areas where students seem to be in urgent need of support.
After noting individual strengths, needs and setting student goals I look at the class as a whole. What trends do I notice across students in the class? These trends often help me to plan my whole group instruction and focus lessons. For example, it seems that there is a point in first grade where illustrations begin to give students less support in their reading. It is at this point that readers have to learn to notice more of the details in the actual text of a story, and use evidence from the words to support their thinking. The highlighted grid really helps me to notice class trends. Additionally, small groups of children with common needs are apparent when looking at the class grid as a whole.
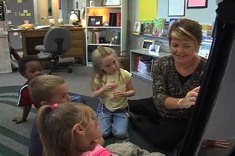
Using this information, I can easily plan and manage the time I spend with class, small groups of students, and individuals. The completed grid, placed on my clipboard for quick reference, helps me to plan weekly instruction, make teaching decisions on the run, and be purposeful across the day. The grid also provides a place for me to quickly mark student progress in daily literacy instruction. During read aloud, I can quickly tailor questions and discussion points to students.
If I know Sarah is having a hard time making predictions, I can stop to ask her what she thinks will happen next and why. I can support Sarah during the read aloud with this strategy she is learning. In a classroom where students use their reading time to make their own book choices, the grid allows me to sit down with the books a student has chosen and have a conversation specific to the reader’s needs. For example, I may join Sarah for a conference in which she has several self-selected books of varying topics and levels in front of her, I can choose one that will help me support her ability to predict or ask her to show me a book where making predictions helped her to think about the story. The grid is a tool that complements my spiral notebook, and allows me make effective use of my planning and teaching time. I think it’s a tool that is here to stay in my assessment system.


