
I have noticed a trend lately that anchor charts seem to be disappearing in classrooms. I see commercially printed posters on the walls outlining character traits or phonetic rules. Or “anchor charts” that came from a publishing company, laminated for eternity. I’ve also noticed beautiful decor adorning the walls—classrooms built around themes of muted neutral colors that frankly make my own living room look drab and unpleasant. These classrooms are stunning, don’t get me wrong. But sometimes I do wonder… who are these classrooms for?
Another trend I have noticed is teachers creating digital slide decks in place of anchor charts. They can capture the teaching point, examples, and even student thinking all in one place with an appealing font and an eye-catching theme. They can save these slide decks and reuse them year after year. They can even add links to other files or media, a benefit definitely not afforded to anchor charts. Why hang those crinkly anchor charts created with Mr. Sketch markers on the wall when you can just as easily make a slide deck? I mean, everyone knows those markers smell good but fade fast, especially mint green.
Yet I still believe anchor charts have advantages that you just cannot capture digitally. Anchor charts are student-centered, they are visible, and they can be powerful teaching tools.
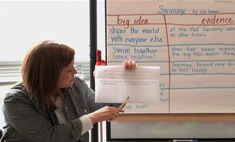
First, anchor charts are a student-centered teaching tool. Anchor charts are meant to be built during the lesson with input from the students. The idea for the anchor chart might exist before the lesson, but the content of the chart is co-created with the students within the lesson. Anchor charts are intended to capture student thinking. They are evidence of the students’ learning, not evidence of the teacher’s planning. Even if you know what the final product will look like, you still build the chart right there in the lesson with the kids. The power of the anchor chart comes from the process of creating it, and in this way it is unlike any slide deck or commercially printed poster.
Second, anchor charts are visible in a way that slide decks are not. They are hanging right there on the classroom wall in plain sight. I once tried to create digital anchor charts using the whiteboard app on my computer and then I housed all of our digital anchor charts on a website. Easy, I thought. Students can just bookmark the site and click it when they need to refer to a chart.
Well, it was easy-ish but not as easy as glancing sideways at the wall next to you. Need to remember the leads we practiced in writing workshop? Look to your left. Looking for a way to track the characters in your book? Look to the back of the room. It is just harder to refer to a digital chart that is seven slides back. This is especially important for our EL students who may refer to the charts for content and for language. Paper anchor charts are just . . . there.
Anchor charts cannot live forever on the walls of our classroom. We have new content to capture, new units to start, and maybe even fire codes to abide by. When it comes time to remove an anchor chart from your classroom walls, you can still make it accessible to students. I like to create mini-versions of our anchor charts by snapping a picture and printing little 4×6 versions. I put the mini-charts in a pocket chart titled “Take What You Need,” and students have everlasting access to the charts we created.
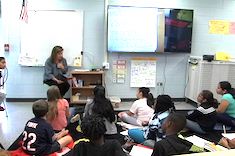
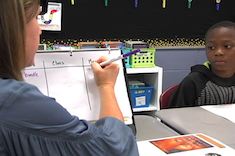
Finally, anchor charts can be powerful teaching tools if you use them. Refer to them in your lessons. Point to them. Stand by them. Have students interact with them. My favorite thing to do to anchor charts is use sticky notes on them. I love when students use sticky notes to revise an anchor chart, or to claim a part of the anchor chart as theirs by putting their initials next to the thinking they contributed.
I know a good teaching tool when I see one. Some teaching tools do need to be replaced in today’s digital age, and I am the first one in line for a good upgrade. But anchor charts? They are golden in any age.