Infographics are intentionally selected or designed visual images such as graphs, charts, or diagrams used to represent ideas, information, or data. Using both text and images, well-designed infographics help writers simplify or streamline the sharing of information with targeted audiences. Infographics can serve as a writer’s main format for sharing information; infographics can also support and enrich texts, acting like familiar photographs or illustrations, but bringing specific information to readers. Readers of all ages find infographics on our digital screens as we read websites and social media as well as the pages of books and other printed publications. Just like the wide range of informational texts and images we find across our reading lives, infographics come in many formats and styles and present readers with ever-expanding learning options.
The Appealing and Necessary Challenge
The old saying “A picture is worth a thousand words” bears truth to the importance of visual literacy in our reading lives. Infographics’ hybrid style of text and visuals captivates readers of all ages. Although the creative nature of infographics add an element of fun to informational reading, we need to take this informational format seriously as well. Our power as informed citizens relies heavily on how well we read infographics. Graphic formats of informational texts are increasingly used by writers in our media and marketing worlds. Scientific and global literacy depend on the wide reading of resources that depend heavily on infographics. Visual literacy affects one’s power as a consumer in an expanding informational ecosystem.
Customer Magnetism, an Internet marketing agency, summarizes the powerful roles infographics play in our reading lives here: http://www.customermagnetism.com/infographics/what-is-an-infographic/
People outside our classroom are reshaping our reading lives with visual formats, so it is important for our students to gain the skills and appreciation for infographics as writers select this format for sharing news and information in ever increasing ways. Our children are growing up in expanding informational ecosystems that overlap in all aspects of their lives, bombarded by visual and quantitative information across their days. These visual and quantitative texts can provide a great deal of information for readers if those readers bring the skills and experiences to this popular nonfiction format. Students deserve instructional time and extended opportunities to read and explore infographics in our learning communities.
The Common Core and Infographics
If you are going to explore the role of infographics in students’ lives, take time to examine why visual and quantitative literacy are now bright lights on our teaching radars. The table below outlines the Common Core’s kindergarten-grade 12 standards for reading and comprehending visual and quantitative information. Take a minute to consider the standards assigned to your current grade level. Look beyond your teaching world and consider what students were expected to learn and master in the previous grades. Then take time to see how students will interact with visual and quantitative information the following year.
Informational Text: Integration of Knowledge and Ideas
CCR Anchor Standard 7: Integrate and evaluate content presented in diverse formats and media, including visually and quantitatively, as well as in words.*
| Grade | Grade-Specific Standard |
| Kindergarten | With prompting and support, describe the relationship between illustrations and the text in which they appear (e.g., what person, place, thing, or idea in the text an illustration depicts). |
| Grade 1 | Use the illustrations and details in a text to describe its key ideas. |
| Grade 2 | Explain how specific images (e.g., a diagram showing how a machine works) contribute to and clarify a text. |
| Grade 3 | Use information gained from illustrations (e.g., maps, photographs) and the words in a text to demonstrate understanding of the text (e.g., where, when, why, and how key events occur). |
| Grade 4 | Interpret information presented visually, orally, or quantitatively (e.g., in charts, graphs, diagrams, time lines, animations, or interactive elements on Web pages) and explain how the information contributes to an understanding of the text in which it appears. |
| Grade 5 | Draw on information from multiple print or digital sources, demonstrating the ability to locate an answer to a question quickly or to solve a problem efficiently. |
| Grade 6 | Integrate information presented in different media or formats (e.g., visually, quantitatively) as well as in words to develop a coherent understanding of a topic or issue. |
| Grade 7 | Compare and contrast a text to an audio, video, or multimedia version of the text, analyzing each medium’s portrayal of the subject (e.g., how the delivery of a speech affects the impact of the words). |
| Grade 8 | Evaluate the advantages and disadvantages of using different mediums (e.g., print or digital text, video, multimedia) to present a particular topic or idea. |
| Grades 9-10 | Analyze various accounts of a subject told in different mediums (e.g., a person’s life story in both print and multimedia), determining which details are emphasized in each account. |
| Grades 11-12 | Integrate and evaluate multiple sources of information presented in different media or formats (e.g., visually, quantitatively) as well as in words in order to address a question or solve a problem. |
*Please see “Research to Build Knowledge” in Writing and “Comprehension and Collaboration” in Speaking and Listening for additional standards relevant to gathering, assessing, and applying information from print and digital sources.
As a fourth-grade teacher, I had three important ideas emerge after studying this progression of standards.
1. Visual and quantitative literacy standards are living across all content areas.
When you examine the K-4 standards, ultimately students will be expected to know how to examine a range of infographics to support their learning across content areas. The implied message presents big expectations for visual and quantitative literacy, moving this kind of informational reading beyond math instruction’s focus on charts, graphs, and tables. This standards chart quietly understates the urgency for supported instruction and practice with visual and quantitative information in different academic areas. Students will need frequent opportunities to read, discuss, and utilize visual and quantitative information across the entire school year. Teachers and students will need to be consciously learning and applying visual and quantitative literacy skills with a variety of print and digital resources. Who will be teaching these skills? When will visual and quantitative literacy be taught? How will students grow skilled and comfortable with this text format and learn to value these resources?
2. Your students’ learning depends on what happened in the grade levels before them.
This is not a new or unique idea for curriculum, learning progressions, or developmental continua. Looking closely at the standards for grades K-3, informational reading strategies now include the close analysis of pictures, photographs, and other infographics for our youngest students. Looking at the images is no longer used “to get those tricky words.” Those key images help the reader learn and get to the ideas. Learning to carefully examine pictures and photographs as a source of information in grades K-3 is the critical foundational element necessary for the work of later grades.
As students move to on to higher grades, it will be assumed that they already know how to examine images for information. As students read and apply higher-level thinking strategies to nonfiction texts, visual and quantitative information will be equally valued. Here are expectations from just the fourth- and fifth-grade standards:
While reading infographics, students will:
- Interpret information presented visually, orally, or quantitatively (Grade 4)
- Explain how the (visual or quantitative) information contributes to an understanding of the text (Grade 4)
- Draw on (visual or quantitative) information from multiple print or digital sources (Grade 5)
- Demonstrate the ability to locate an answer . . . quickly using (visual or quantitative) information (Grade 5)
- Solve a problem efficiently using (visual or quantitative) information (Grade 5)
3. Images are valuable sources of information
In grades K-3, the standards expect more from students; readers are expected to do more than just use photographs and pictures to help them decode words in nonfiction texts. Children will now be expected to read and understand images as a nonfiction text. Students will be expected to extract information from the images and explain how this visual information helps them understand the text while learning new ideas. Students are being asked to read and explain how the selected visual information supplied by the author supports students’ comprehension; they will need to consider why a particular visual was matched with the informational text to support it.
- What information is gained from this photograph/picture?
- Where is the information in the image?
- How does this information connect to our topic?
- How can we use the picture’s information to help our learning?
- Why do you think this image is important?
- Explain why you think the writer matched this image to this text.
As students move into fourth grade, this kind of thinking and interaction will now occur with infographics beyond pictures and photographs. Time lines, charts, and tables are just a few of the infographics that students will now read and relish like favorite stories, magazines, and websites.
A Resource Revolution
When asked recently about the role of infographics in my own classroom library and my work with children, I blurted out these words: “I am stoked.” How does a 50-year-old woman get away with using this phrase? Here is the Urban Dictionary’s definition of stoked:
stoked—adjective—to be “stoked” is to be intensely enthusiastic, exhilarated, or excited about something. those who are stoked all of the time know this; being stoked is the epitome of all being. When one is stoked, there is no limit to what one can do.
Considering this definition, my word choice truly matches my literacy attitude. I am enthusiastic about expanding readers’ views of informational texts. I am excited about showing students how easy it is to find infographics to read and celebrate in their learning. There is a nearly unlimited supply of infographics waiting to be used and explored by readers in the classroom.
Finding Infographics
Here are some of my favorite sources for infographics and other visuals to support them on the web.
General Interest
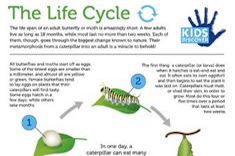
Kids Discover: http://www.kidsdiscover.com/infographics/
The New York Times: What’s Going On in This Picture?: http://learning.blogs.nytimes.com/category/lesson-plans/whats-going-on-in-this-picture/
On This Day: http://learning.blogs.nytimes.com/on-this-day/
Brandon Stanton’s Humans of New York Project: http://www.humansofnewyork.com/ You will need to be selective about the pictures you select, as the responses of certain adults are very candid and perhaps age inappropriate. There are many wonderful pictures to share that allow a reader to study and uncover a story, its possible details, and visible facts.
http://www.pinterest.com/rtkrum/cool-infographics-gallery/
Dogs
https://magic.piktochart.com/output/1238485-dogs#
School
Why do we need librarians? https://magic.piktochart.com/v/b85bc5e1-da03-4611-98f4-5cae6b25104c
Sports
World Cup Stadiums: http://www.pinterest.com/pin/171207223309672049/
Art
What are the elements of art? http://mrswyvellfink.edu.glogster.com/art-elements/?=glogpedia-source
Music
Michael Jackson: http://ivonelinn.edu.glogster.com/michael-jackson-biography/?=glogpedia-source
Health
What is Influenza? http://btracyh.edu.glogster.com/the-influenza/?=glogpedia-source
Info about Skin: http://www.pinterest.com/pin/171207223308506945/
Culture
Comparing Soldiers’ Uniforms: http://www.pinterest.com/pin/171207223309584481/
Disney Parks: http://www.pinterest.com/pin/171207223309011719/
Technology
Using a Webcam: http://www.pinterest.com/pin/171207223308462955/
What do colors communicate? http://www.pinterest.com/pin/171207223308069928/
The History of Music Media: http://www.pinterest.com/pin/171207223307889068/
Infographics on Glogster
Glogster EDU is an online, easy-to-use platform for digital reading, writing, and learning. Glogster is a website providing “digital paper” or “glogs”; the digital tools allow students to represent their thinking through digital creations that can be shared with their school and home communities. The glogs provide the same creative freedom as collage on paper while expanding creative possibilities for students as they can integrate and mix their own text, audio, video, images, graphics, and data. Think of Glogster as an interactive Smartboard living on a page that writers and readers can access from any computer or iPad.
Here are a few student-created glogs from the website’s public page.
http://meganpepsicola.edu.glogster.com/assignment-2-pancreas-poster/?=glogpedia-source
http://jwarbing.edu.glogster.com/martha-graham/?=glogpedia-source
http://haizenaroaenara.edu.glogster.com/freeride-snowboard/?=glogpedia-source
The creative possibilities extend across the academic day and give students many options for sharing ideas while creating learning options for others. Not only would this site provide mentor texts for reading comprehension instruction centering on infographics, but Glogster allows students to apply their understanding of infographics by creating their own interactive texts. I love how this tool allows for both reading and writing opportunities.
A good infographic can deliver a lot of information in an easy-to-understand format. As teachers, we know that we are on a mission to develop all aspects of our students’ reading lives. Standards are part of the “why?” supporting our instructional choices with children. Standards and sound instructional practices build a serious foundation for our work. However, it is the “OH MY GOSH” moments that fuel our work with children. Infographics fuel a passion for informational texts in students, and this excitement is what I hope to share with readers.